반응형
Parameter Mandatory Range Default Description
AlertScriptsPath no
/usr/local/share/zabbix/alertscripts Location of custom alert scripts (depends on compile-time installation variable datadir).
AllowRoot no
0 Allow the server to run as 'root'. If disabled and the server is started by 'root', the server will try to switch to the 'zabbix' user instead. Has no effect if started under a regular user.
0 - do not allow
1 - allow
This parameter is supported since Zabbix 2.2.0.
CacheSize no 128K-8G 8M Size of configuration cache, in bytes.
Shared memory size for storing host, item and trigger data.
Upper limit used to be 2GB before Zabbix 2.2.3.
CacheUpdateFrequency no 1-3600 60 How often Zabbix will perform update of configuration cache, in seconds.
See also runtime control options.
DBHost no
localhost Database host name.
In case of MySQL localhost or empty string results in using a socket. In case of PostgreSQL
only empty string results in attempt to use socket.
DBName yes

Database name or path to database file for SQLite3 (multi-process architecture of Zabbix does not allow to use in-memory database, e.g. :memory:file::memory:?cache=shared or file:memdb1?mode=memory&cache=shared).
DBPassword no

Database password. Ignored for SQLite.
Comment this line if no password is used.
DBPort no 1024-65535 3306 Database port when not using local socket. Ignored for SQLite.
DBSchema no

Schema name. Used for IBM DB2 and PostgreSQL.
DBSocket no
/tmp/mysql.sock Path to MySQL socket.
DBUser no

Database user. Ignored for SQLite.
DebugLevel no 0-5 3 Specifies debug level:
0 - basic information about starting and stopping of Zabbix processes
1 - critical information
2 - error information
3 - warnings
4 - for debugging (produces lots of information)
5 - extended debugging (produces even more information)
See also runtime control options.
ExternalScripts no
/usr/local/share/zabbix/externalscripts Location of external scripts (depends on compile-time installation variable datadir).
Fping6Location no
/usr/sbin/fping6 Location of fping6.
Make sure that fping6 binary has root ownership and SUID flag set.
Make empty (“Fping6Location=”) if your fping utility is capable to process IPv6 addresses.
FpingLocation no
/usr/sbin/fping Location of fping.
Make sure that fping binary has root ownership and SUID flag set!
HistoryCacheSize no 128K-2G 16M Size of history cache, in bytes.
Shared memory size for storing history data.
HistoryIndexCacheSize no 128K-2G 4M Size of history index cache, in bytes.
Shared memory size for indexing history data stored in history cache.
The index cache size needs roughly 100 bytes to cache one item.
This parameter is supported since Zabbix 3.0.0.
HousekeepingFrequency no 0-24 1 How often Zabbix will perform housekeeping procedure (in hours).
Housekeeping is removing outdated information from the database.
Note: To prevent housekeeper from being overloaded (for example, when history and trend periods are greatly reduced), no more than 4 times HousekeepingFrequency hours of outdated information are deleted in one housekeeping cycle, for each item. Thus, if HousekeepingFrequency is 1, no more than 4 hours of outdated information (starting from the oldest entry) will be deleted per cycle.
Note: To lower load on server startup housekeeping is postponed for 30 minutes after server start. Thus, if HousekeepingFrequency is 1, the very first housekeeping procedure after server start will run after 30 minutes, and will repeat with one hour delay thereafter. This postponing behavior is in place since Zabbix 2.4.0.
Since Zabbix 3.0.0 it is possible to disable automatic housekeeping by setting HousekeepingFrequency to 0. In this case the housekeeping procedure can only be started by housekeeper_execute runtime control option and the period of outdated information deleted in one housekeeping cycle is 4 times the period since the last housekeeping cycle, but not less than 4 hours and not greater than 4 days.
See also runtime control options.
Include no

You may include individual files or all files in a directory in the configuration file.
To only include relevant files in the specified directory, the asterisk wildcard character is supported for pattern matching. For example: /absolute/path/to/config/files/*.conf. Pattern matching is supported since Zabbix 2.4.0.
See special notes about limitations.
JavaGateway no

IP address (or hostname) of Zabbix Java gateway.
Only required if Java pollers are started.
This parameter is supported since Zabbix 2.0.0.
JavaGatewayPort no 1024-32767 10052 Port that Zabbix Java gateway listens on.
This parameter is supported since Zabbix 2.0.0.
ListenIP no
0.0.0.0 List of comma delimited IP addresses that the trapper should listen on.
Trapper will listen on all network interfaces if this parameter is missing.
Multiple IP addresses are supported since Zabbix 1.8.3.
ListenPort no 1024-32767 10051 Listen port for trapper.
LoadModule no

Module to load at server startup. Modules are used to extend functionality of the server.
Format: LoadModule=<module.so>
The modules must be located in directory specified by LoadModulePath.
It is allowed to include multiple LoadModule parameters.
LoadModulePath no

Full path to location of server modules.
Default depends on compilation options.
LogFile yes, if LogType is set to file, otherwise
no


Name of log file.
LogFileSize no 0-1024 1 Maximum size of log file in MB.
0 - disable automatic log rotation.
Note: If the log file size limit is reached and file rotation fails, for whatever reason, the existing log file is truncated and started anew.
LogType no
file Log output type:
file - write log to file specified by LogFile parameter,
system - write log to syslog,
console - write log to standard output.
This parameter is supported since Zabbix 3.0.0.
LogSlowQueries no 0-3600000 0 How long a database query may take before being logged (in milliseconds).
0 - don't log slow queries.
This option becomes enabled starting with DebugLevel=3.
This parameter is supported since Zabbix 1.8.2.
MaxHousekeeperDelete no 0-1000000 5000 No more than 'MaxHousekeeperDelete' rows (corresponding to [tablename], [field], [value]) will be deleted per one task in one housekeeping cycle.
SQLite3 does not use this parameter, deletes all corresponding rows without a limit.
If set to 0 then no limit is used at all. In this case you must know what you are doing!
This parameter is supported since Zabbix 1.8.2 and applies only to deleting history and trends of already deleted items.
PidFile no
/tmp/zabbix_server.pid Name of PID file.
ProxyConfigFrequency no 1-604800 3600 How often Zabbix server sends configuration data to a Zabbix proxy in seconds. Used only for proxies in a passive mode.
This parameter is supported since Zabbix 1.8.3.
ProxyDataFrequency no 1-3600 1 How often Zabbix server requests history data from a Zabbix proxy in seconds. Used only for proxies in a passive mode.
This parameter is supported since Zabbix 1.8.3.
SenderFrequency no 5-3600 30 How often Zabbix will try to send unsent alerts (in seconds).
SNMPTrapperFile no
/tmp/zabbix_traps.tmp Temporary file used for passing data from SNMP trap daemon to the server.
Must be the same as in zabbix_trap_receiver.pl or SNMPTT configuration file.
This parameter is supported since Zabbix 2.0.0.
SourceIP no

Source IP address for outgoing connections.
SSHKeyLocation no

Location of public and private keys for SSH checks and actions
SSLCertLocation no

Location of SSL client certificate files for client authentication.
This parameter is used in web monitoring only and is supported since Zabbix 2.4.
SSLKeyLocation no

Location of SSL private key files for client authentication.
This parameter is used in web monitoring only and is supported since Zabbix 2.4.
SSLCALocation no

Override the location of certificate authority (CA) files for SSL server certificate verification. If not set, system-wide directory will be used.
Note that the value of this parameter will be set as libcurl option CURLOPT_CAPATH. For libcurl versions before 7.42.0, this only has effect if libcurl was compiled to use OpenSSL. For more information see cURL web page.
This parameter is used in web monitoring since Zabbix 2.4.0 and in SMTP authentication since Zabbix 3.0.0.
StartDBSyncers no 1-100 4 Number of pre-forked instances of DB Syncers.
The upper limit used to be 64 before version 1.8.5.
This parameter is supported since Zabbix 1.8.3.
StartDiscoverers no 0-250 1 Number of pre-forked instances of discoverers.
The upper limit used to be 255 before version 1.8.5.
StartEscalators no 1-100 1 Number of pre-forked instances of escalators.
This parameter is supported since Zabbix 3.0.0.
StartHTTPPollers no 0-1000 1 Number of pre-forked instances of HTTP pollers.
The upper limit used to be 255 before version 1.8.5.
StartIPMIPollers no 0-1000 0 Number of pre-forked instances of IPMI pollers.
The upper limit used to be 255 before version 1.8.5.
StartJavaPollers no 0-1000 0 Number of pre-forked instances of Java pollers.
This parameter is supported since Zabbix 2.0.0.
StartPingers no 0-1000 1 Number of pre-forked instances of ICMP pingers.
The upper limit used to be 255 before version 1.8.5.
StartPollersUnreachable no 0-1000 1 Number of pre-forked instances of pollers for unreachable hosts (including IPMI and Java).
Since Zabbix 2.4.0, at least one poller for unreachable hosts must be running if regular, IPMI or Java pollers are started.
The upper limit used to be 255 before version 1.8.5.
This option is missing in version 1.8.3.
StartPollers no 0-1000 5 Number of pre-forked instances of pollers.
Note that a non-zero value is required for internal, aggregated and calculated items to work.
StartProxyPollers no 0-250 1 Number of pre-forked instances of pollers for passive proxies.
The upper limit used to be 255 before version 1.8.5.
This parameter is supported since Zabbix 1.8.3.
StartSNMPTrapper no 0-1 0 If set to 1, SNMP trapper process will be started.
This parameter is supported since Zabbix 2.0.0.
StartTimers no 1-1000 1 Number of pre-forked instances of timers.
Timers process time-based trigger functions and maintenance periods.
Only the first timer process handles the maintenance periods.
This parameter is supported since Zabbix 2.2.0.
StartTrappers no 0-1000 5 Number of pre-forked instances of trappers.
Trappers accept incoming connections from Zabbix sender, active agents and active proxies.
At least one trapper process must be running to display server availability and view queue in the frontend.
The upper limit used to be 255 before version 1.8.5.
StartVMwareCollectors no 0-250 0 Number of pre-forked vmware collector instances.
This parameter is supported since Zabbix 2.2.0.
Timeout no 1-30 3 Specifies how long we wait for agent, SNMP device or external check (in seconds).
TLSCAFile no

Full pathname of a file containing the top-level CA(s) certificates for peer certificate verification, used for encrypted communications between Zabbix components.
This parameter is supported since Zabbix 3.0.0.
TLSCertFile no

Full pathname of a file containing the server certificate or certificate chain, used for encrypted communications between Zabbix components.
This parameter is supported since Zabbix 3.0.0.
TLSCRLFile no

Full pathname of a file containing revoked certificates. This parameter is used for encrypted communications between Zabbix components.
This parameter is supported since Zabbix 3.0.0.
TLSKeyFile no

Full pathname of a file containing the server private key, used for encrypted communications between Zabbix components.
This parameter is supported since Zabbix 3.0.0.
TmpDir no
/tmp Temporary directory.
TrapperTimeout no 1-300 300 Specifies how many seconds trapper may spend processing new data.
TrendCacheSize no 128K-2G 4M Size of trend cache, in bytes.
Shared memory size for storing trends data.
UnavailableDelay no 1-3600 60 How often host is checked for availability during the unavailability period, in seconds.
UnreachableDelay no 1-3600 15 How often host is checked for availability during the unreachability period, in seconds.
UnreachablePeriod no 1-3600 45 After how many seconds of unreachability treat a host as unavailable.
User no
zabbix Drop privileges to a specific, existing user on the system.
Only has effect if run as 'root' and AllowRoot is disabled.
This parameter is supported since Zabbix 2.4.0.
ValueCacheSize no 0,128K-64G 8M Size of history value cache, in bytes.
Shared memory size for caching item history data requests.
Setting to 0 disables value cache (not recommended).
When value cache runs out of the shared memory a warning message is written to the server log every 5 minutes.
This parameter is supported since Zabbix 2.2.0.
VMwareCacheSize no 256K-2G 8M Shared memory size for storing VMware data.
A VMware internal check zabbix[vmware,buffer,…] can be used to monitor the VMware cache usage (see Internal checks).
Note that shared memory is not allocated if there are no vmware collector instances configured to start.
This parameter is supported since Zabbix 2.2.0.
VMwareFrequency no 10-86400 60 Delay in seconds between data gathering from a single VMware service.
This delay should be set to the least update interval of any VMware monitoring item.
This parameter is supported since Zabbix 2.2.0.
VMwarePerfFrequency no 10-86400 60 Delay in seconds between performance counter statistics retrieval from a single VMware service.
This delay should be set to the least update interval of any VMware monitoring item that uses VMware performance counters.
This parameter is supported since Zabbix 2.2.9, 2.4.4
VMwareTimeout no 1-300 10 The maximum number of seconds vmware collector will wait for a response from VMware service (vCenter or ESX hypervisor).
This parameter is supported since Zabbix 2.2.9, 2.4.4


출처: <https://www.zabbix.com/documentation/3.0/manual/appendix/config/zabbix_server>

반응형
반응형

Zabbix value cache working in low memory mode

22-01-2018, 15:55

Hi i see this messenger in my dashboard:


Zabbix value cache working in low memory mode


but i already change the file /etc/zabbix/zabbix_server.conf:


### Option: VMwareCacheSize

# Size of VMware cache, in bytes.

# Shared memory size for storing VMware data.

# Only used if VMware collectors are started.

#

# Mandatory: no

# Range: 256K-2G

# Default:

#VMwareCacheSize=8MB (valor padrado)

VMwareCacheSize=2G


### Option: CacheSize

# Size of configuration cache, in bytes.

# Shared memory size for storing host, item and trigger data.

#

# Mandatory: no

# Range: 128K-8G

# Default:

CacheSize=16G


### Option: HistoryIndexCacheSize

# Size of history index cache, in bytes.

# Shared memory size for indexing history cache.

#

# Mandatory: no

# Range: 128K-2G

# Default:

# HistoryIndexCacheSize=4M

HistoryIndexCacheSize=200M


### Option: ValueCacheSize

# Size of history value cache, in bytes.

# Shared memory size for caching item history data requests.

# Setting to 0 disables value cache.

#

# Mandatory: no

# Range: 0,128K-64G

# Default:

# ValueCacheSize=8M

ValueCacheSize=100M


What can i do to resolve this problem?

Thanks

Tags: None


출처: <https://www.zabbix.com/forum/zabbix-help/52925-zabbix-value-cache-working-in-low-memory-mode>

반응형
반응형

http://software.naver.com/software/fontList.nhn?categoryId=I0000000

네이버에서 적당한 폰트를 구해 다운로드 합니다.

Zabbix Server에 다운로드한 font /usr/share/zabbix/fonts에 업로드 합니다.

# mv /usr/share/zabbix/fonts/graphfont.ttf /usr/share/zabbix/fonts/graphfont.ttf.org

저의 경우는 다운로드 한 파일이 NanumGothic.ttf이므로

# mv /usr/share/zabbix/fonts/NanumGothic.ttf /usr/share/zabbix/fonts/graphfont.ttf

이렇게 했습니다.


cp /tmp/NanumGothic.ttf /usr/share/zabbix/fonts/graphfont.ttf


Zabbix 4.x 버전의 font 위치는 /usr/share/zabbix/assets/fonts/graphfont.ttf 변경이 되었다.


출처: <https://naiggy.blogspot.com/2017/02/zabbix_28.html>

반응형
반응형


http://berukann.hatenablog.jp/entry/2017/12/24/033319


요약

Zabbix3.4에서 WindowsOS 템플릿을 적용 할 때 자동 시작 서비스 모니터링 경보가 귀찮다

예 : Service "sppsvc"(Software Protection) is not running (startup type automatic delayed)

예 : Service "RemoteRegistry"(Remote Registry) is not running (startup type automatic)

단, 트리거 자체는 무효로하고 싶지 않기 때문에 불필요하다고 판단한 서비스 만 제외


문제

Windows OS의 템플릿을 Windows 2012 R2에 적용했을 때 자동 시작 서비스를 시작하지 않는 취지의 경고가 귀찮다


해결책

제외하고 싶은 서비스 만의 검색에서 제외한다. 구체적인 방법은 다음입니다

[Administration] -> General을 선택하고 오른쪽의 풀다운 메뉴에서 [Regular expressions를 선택


[Windows service names for discovery를 선택하고 [Expression]에 제외 할 서비스를 추기하기

수정 전 : ^ (MMCSS | gupdate | SysmonLog | clr_optimization_v2.0.50727_32 | clr_optimization_v4.0.30319_32) $

수정 후 : ^ (MMCSS | gupdate | wuauserv | TrustedInstaller | sppsvc | RemoteRegistry | SysmonLog | clr_optimization_v2.0.50727_32 | clr_optimization_v4.0.30319_32) $

모니터링을 Zabbix에서 한 번 지우고 다시 등록하면 제외 된 서비스가 검색되지 않을것임


^(MMCSS|gupdate|SysmonLog|clr_optimization_v2.0.50727_32|clr_optimization_v4.0.30319_32)$


^(MMCSS|gupdate|wuauserv|TrustedInstaller|sppsvc|RemoteRegistry|SysmonLog|clr_optimization_v2.0.50727_32|clr_optimization_v4.0.30319_32)$


반응형
반응형

Zabbix use web monitoring for FTP check

Posted: July 10, 2012 | Author: Chris | Filed under: Zabbix |2 Comments

Zabbix web scenarios use cURL to check your web pages and cURL can be used to connect/download/upload to a FTP server, so I thought I could combine the two and see what happens. Well, this check works a lot better than the original FTP check I had created so I’d say it’s a success. As a bonus, you get download throughput and response time metrics for your FTP session checks.

Create web scenario

Here’s how you can set up web monitoring for FTP. First, create your web scenario under ConfigurationWeb. Select a host to assign this web check to and then select Create Scenario.

I kept everything at the default settings and created a single step to download a file from the FTP server as a test that everything is working properly.

Application - web (or something similar)
Name - FTP check
Authentication - none (I pass username/password in URL)
Update interval - 60
Agent - Internet Explorer 6.0 ( default, haven't tried other agents)
Status - active
Variables - empty
Steps -
     name - FTP check
     URL -
ftp://username:password@servername.domain.com
     post - empty
     timeout - 15
     required - filename (this is the file you want to check for on the FTP server)
     status codes - 226 (
FTP server response codes)

Trigger Configuration

Once your scenario is in place you can create a trigger to fire when something isn’t right. Select ConfigurationHost and select the host you created the web scenario under. Select Triggers and Create Trigger. Name your new trigger and choose the expression to trigger off of. I usually choose the ‘failed step of scenario…’ expression and set it to ‘last value NOT N’ with a value of zero. This way anything that isn’t a success will cause a trigger to fire.

name - FTP check
expression - {HOST_A:web.test.fail[FTP check].last(0)}#0
event generation - normal
severity - high

Once all of that is finished check your new monitor entry under MonitoringWeb. If you want to get a little more advanced with your FTP checks, you can add a trigger that fires when the response time is too long. Just a thought.

The web monitoring doesn’t have to be used only for monitoring actual web pages. cURL is very powerful and can allow for some great checks for your Zabbix environment. Learn more about cURL’s awesomeness here.


출처: <https://mypoorbraindump.wordpress.com/2012/07/10/zabbix-use-web-monitoring-for-ftp-check/>

반응형
반응형

우선 서버 로그를 확인 하고 오류를 확인 한다.

로그 위치는 :


/var/log/zabbix/zabbix_server.log


please increase cachesize configuration parameter zabbix

=> 메모리 부족 에러가 난다 기본은 8M 이다


Cache size 증설

이것을 32M 바꾸어 주니 해결이 되었다.


8G까지 확장 가능하다.


/etc/zabbix/zabbix_server.conf 내용을 수정하면 된다.

반응형
반응형


반응형
반응형
 Jmeter 사용한 Stress Test (웹서버 부하(스트레스) 테스트)
 

1. JMeter의 소개


JMeter는 Apache Jakarta 프로젝트의 일환으로 만들어진 테스트 기능과 퍼포먼스를 측정하는 애플리케이션이다. 이 애플리케이션 100% 순수 자바로 작성되었으며 원래 웹 애플리케이션을 위해 디자인되고 사용되었으나 현재는 다른 기능의 테스트를 위해 확장되고 있다.


JMeter는 static, dynamic 한 모든 자원(파일, 서블릿, perl script, java object, database and query, ftp, soap 등)에 대해 퍼포먼스를 테스트할 수 있다. 이러한 테스트 결과로 분석결과를 그래픽으로 표시해주는 기능과 스크립트 객체 등에 대해 과도한 동시 처리 부하가 가능하다.


Apache Jmeter는 다음 사이트에서 얻을 수 있다.


http://jakarta.apache.org/jmeter/


JMeter에 대한 추가 정보는 위 사이트에서 얻을 수 있다. 한데 위 사이트는 영어로 구성되어 있기 때문에 조금 빈약하더라도 한국어로 된 정보는 자카르타 서울 프로젝트에서 얻을 수 있다.


http://jakarta.apache-korea.org


2. JMeter를 얻고 설치하기


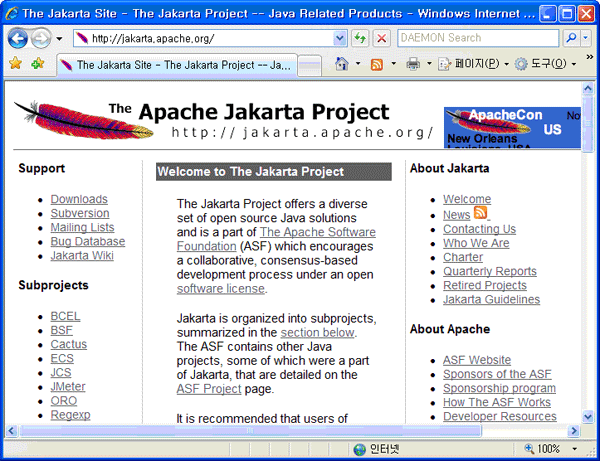
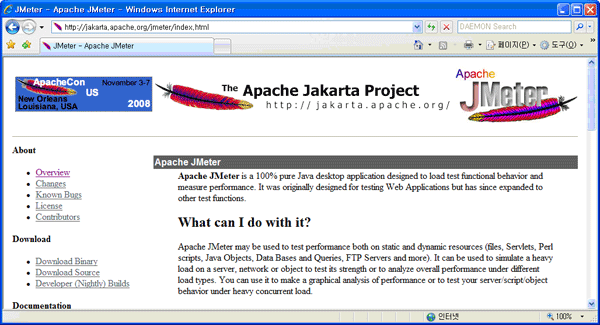
JMeter를 설치 하기 위해서 우선 Jakarta 의 JMeter 사이트에 접속한다. 다음 그림들은 Jakarta 메인 사이트와 JMeter 사이트를 보여준다.


[그림 2-1] Jakarta 사이트


[그림 2-2] Jakarta JMeter 사이트


JMeter를 다운로드 받기 위해선 화면 왼쪽의 Download Binary 링크를 통해 들어가면 다운로드 받을 수 있다.


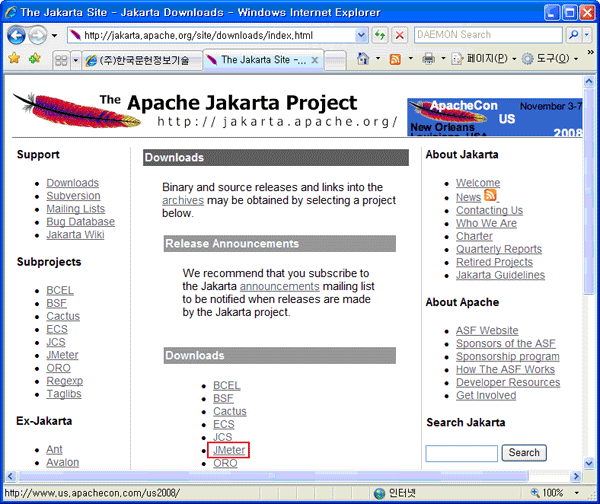
[그림 2-3] Jakarta 다운로드 링크 페이지


Jakarta 프로젝트는 다수의 서브 프로젝트들로 이뤄져 있기 때문에 실제적인 다운로드는 Downloads 섹션의 Jmeter를 클릭하면 다운로드 받을 수 있게 된다. [그림 2-3]은 그 화면을 나타낸다.


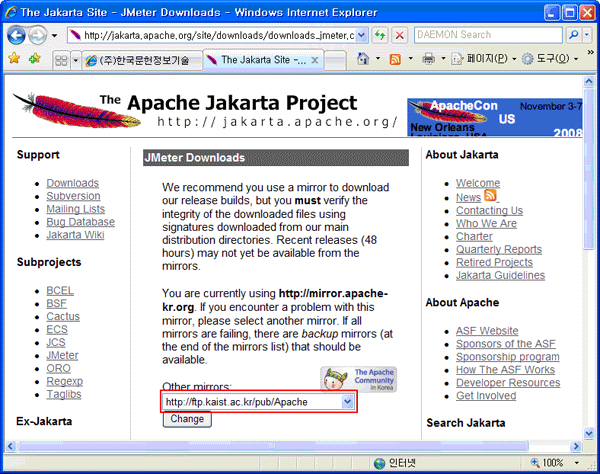
[그림 2-4] Mirror 페이지


[그림 2-3]에서 JMeter 를 클릭하면 곧 바로 다운로드를 시작하지는 않고 어디서 다운로드 받을지 물어오게 된다. 본 문서에서는 미러 사이트로 한국 아파치 사용자 모임을 선택했다. [그림 2-4]에 보이는 빨간 박스를 클릭하면 미러 사이트가 나타나게 된다. 미러 사이트를 선택했다면 Change 버튼을 눌러 미러 페이지를 변경시킨다.


미러 사이트는 다수가 존재하는데 다운로드 속도가 느릴 경우 바꿔가며 시도해본다. 일반적으로 기본적으로 선택되는 미러 사이트를 이용해도 된다.


[그림 2-5] JMeter 다운로드 링크


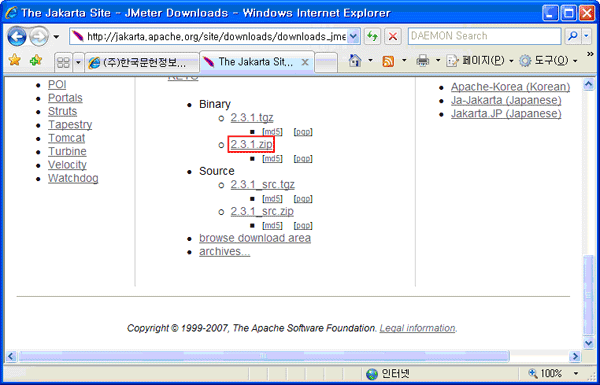
[그림 2-4]의 화면에서 미러 사이트를 변경하지 않았거나 변경한 경우 화면 스크롤을 내리면 빨간박스로 그려진 부분 2.3.1.zip 부분을 볼 수 있다. 이 부분을 클릭하면 본격적인 다운로드 윈도우를 볼 수 있다.


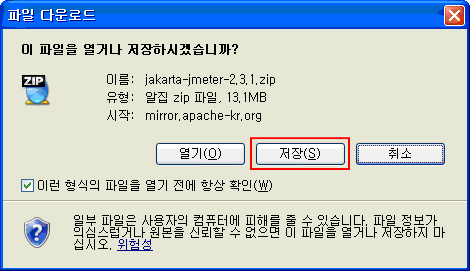
[그림 2-6] 파일 저장 윈도우


[그림 2-6]에서 보여지는 윈도우는 파일을 어디에 저장할 것인지를 물어오는 화면이다. 본문에서는 바탕 화면에 저장하였다.


[그림 2-7] 바탕화면에 저장된 JMeter 파일


[그림 2-6]에서 바탕 화면에 저장된 파일은 [그림 2-7]과 같다.


[그림 2-8] JMeter 실행 파일


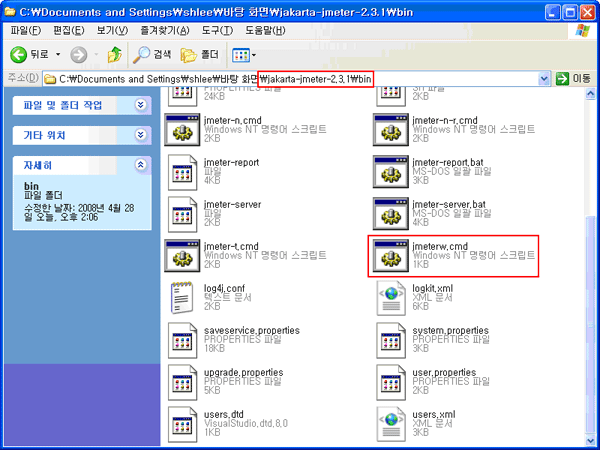
JMeter는 Java Application 이기 때문에 별도의 설치 프로그램을 필요로 하지 않는다. 본문에서는 압축파일을 선택한 후 바탕 화면 폴더에 압축 내용을 별도의 폴더 생성 과정 없이 풀었다. 이렇게 푸는 이유는 JMeter 압축파일이 별도의 상위 폴더를 가지고 있기 때문이다. [그림 2-8]은 그런 화면을 나타낸다.


JMeter의 실행은 [그림 2-8]에 보이는 것처럼 jmeterw.cmd 파일을 더블 클릭하면 실행한다.


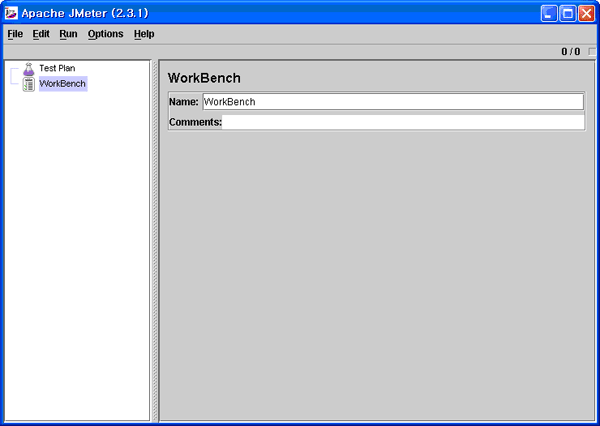
[그림 2-9] JMeter의 실행 화면


3. JMeter 기본 과정


JMeter는 테스트 환경에 있어 상위 항목으로 WorkBench와 Test Plan를 두고 있다. 이 상위 항목을 다른 이름으로 노드라고 표현한다. 노드라는 단어는 Tree에서 비롯되었는데 JMeter는 각각의 element를 계층적으로 관리 하기 위해서 Tree 구조를 사용한다. JMeter는 테스트 앞서 Test Plan을 먼저 작성하게 된다. Test Plan은 한국어로 풀어 쓰면 테스트 계획인데 JMeter의 모든 Test는 이 Test Plan을 먼저 세워야 한다.

Test Plan
  + HTTP Test
WorkBench

[모식도 3-1] JMeter 모식도


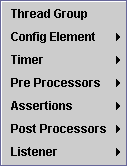
[모식도 3-1]은 위에서 설명한 구조를 간략히 그려내 본 것이다. JMeter는 Test Plan과 WorkBench 아래에 놓이는 것을 가리켜 Element라고 한다. 한국어로는 요소라는 말이 적절하겠지만 이해를 돕기 위해 원어로 표기한다. Element는 여러 종류가 있는데 Test Plan에 바로 올 수 있는 Element는 다음과 같은 것들이 있다.


[그림 3-1] Test Plan 에 추가될 수 있는 element


[그림 3-1]은 Test Plan 노드 아래 추가될 수 있는 element를 나타내고 있는데 기본 테스트를 하기 위해선 Thread Group과 Listener 의 추가가 우선적이다. Thread Group는 테스트의 가장 기본적인 요소로써 Test Plan 노드 아래 몇 개든 올 수 있다. Thread Group은 논리적인 모습으로 표현하면 테스트 클라이언트들의 묶음이라고 보는 표현이 타당하다.


JMeter는 단지 Thread Group을 구성하는 것만으로 결과를 볼 수 없다. 이 뚱딴지 같은 이야기는 JMeter가 결과를 보기 위한 또 다른 구성 요소를 필요로 한다는 것이다. JMeter는 테스트 결과를 다양한 형태로 볼 수 있도록 다음과 같은 구성 요소를 지원한다.


[그림 3-2] Listener의 구성 요소


[그림 3-2]에 보이는 element 중 가장 많이 사용되는 요소는 Graph Results, Summary Report, View Results in Table, View Results Tree다.


다시 앞으로 돌아가서 Thread Group은 테스트에 있어서 기본적인 단위가 된다고 했다. 이제 Thread Group 아래 다른 element를 추가할 필요가 있다.


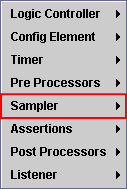
Test Plan 노드에 Thread Group을 추가한 후 마우스 오른쪽 클릭을 통해 보면 [그림 3-1]에서 보던 것과 비슷한 화면이 보이는데 하나 더 추가된 element 그룹이 존재한다.


[그림 3-3] Thread Group에서의 마우스 오른쪽 팝업


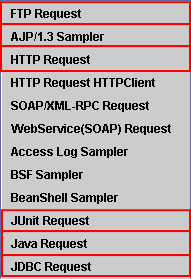
[그림 3-3]에는 Sampler 그룹이 보이는데 바로 이 그룹이 JMeter 테스트에 있어서 실제로 부하를 보내는 실제적인 주체가 들어 있는 그룹이다. Sampler는 다양한 element가 들어가 있는데 대표적으로 다음과 같은 sampler 항목을 들어볼 수 있다.


[그림 3-4] 많이 쓰이는 Sampler


Sampler는 위의 그림에 보이는 것보다 더 많지만 기본적인 기능 테스트 및 웹 애플리케이션 테스트에는 [그림 3-4]에 있는 Sampler가 더 많이 쓰인다.


본문에서는 HTTP Request Sampler에 대해서만 집중적으로 다룰텐데 다른 Sampler에 대해선 다른 기회가 주어진다면 하나씩 파보는 기회를 가져보도록 하겠다.


Thread Group에는 Sampler 뿐 아니라 다른 element들도 추가가 가능한데 이들 element에 대해서도 다른 기회가 주어졌을 때 파보는 기회를 가져보겠다.


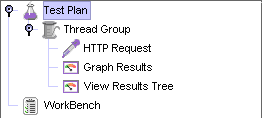
자 이제까지 설명한 것은 JMeter에서 스트레스 테스트를 하기 위한 기본 구조를 설명하였다. [그림 3-5]는 지금까지 설명한 구조를 실제로 구현한 JMeter의 Test Plan 의 모습이다.


[그림 3-5] 간단한 Test를 위한 Test Plan


다음 섹션에서는 [그림 3-5]를 기반으로 한 Simple한 Test를 진행해보겠다.


http://network.hanb.co.kr/view.php?bi_id=1521


4. JMeter를 사용한 Simple Test


지금까지 간략히 JMeter의 테스트 계획에 대해서 알아보았는데 본 섹션에서는 앞에서 다루었던 Test Plan에 실제 숨을 불어넣어 본다.


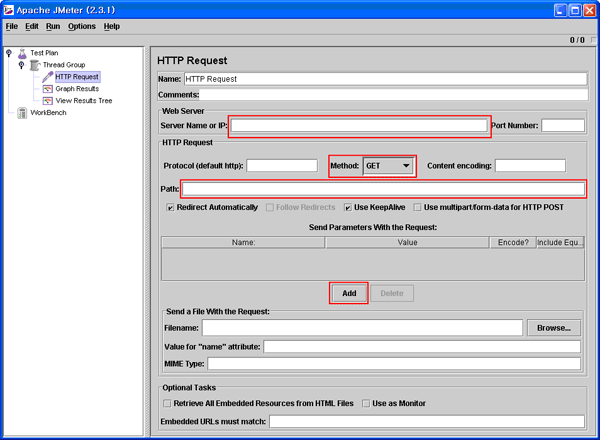
본문에서는 저자가 운영진으로 활동하고 있는 한국 아파치 사용자 모임 사이트를 대상으로 삼았다. 우선 HTTP Request 노드를 선택하면 JMeter 의 오른쪽 화면이 바뀌면서 [그림 4-1]처럼 나타나게 된다.


[그림 4-1] HTTP Request 선택


[그림 4-1]에는 빨간 박스가 다수 보이는데 이 박스 안의 내용을 입력하거나 선택함으로서 테스트 정보를 입력한다.


첫번째 입력할 정보는 테스트할 서버의 IP 또는 URL을 입력하는데 URL은 프로토콜 정보를 제외한 순수 주소만 적는다. 다음과 같은 URL이 테스트할 정보라고 보고 Server Name을 분리하자.


http://www.apache-kr.org/www/board.php?cmd=retrieveContent&board_cd=techtalk&rg_d=20080410&rg_seq_n=1&pageID=1&search_gb=&fr_rg_d=&to_rg_d=&searchstring=

Server Name은 www.apache-kr.org가 되어야 한다.


두번째 입력하고 선택할 정보는 Method와 Path인데 이 정보는 실제로 테스트할 URL 정보가 들어간다.


Path는 실제 테스트할 URL을 말하는데 / 로부터 시작하고 인자가 시작되기 전까지의 정보를 적는다. 앞에서 언급된 URL을 기준으로 path는 아래와 같이 분리된다.

/www/board.php

위에서 나타난 파일이 어떤 인자를 받는다면 그 인자 방식을 Method에서 선택해준다. 여러 Method를 사용할 수 있지만 웹 애플리케이션은 일반적으로 GET 방식과 POST 방식을 사용한다. 예제로 쓰는 URL은 모든 정보를 GET 방식으로 던진다. 따라서 Method는 GET으로 지정한다. 물론 인자를 받지 않는다면 Parameter 정보를 입력하지 않아도 된다.


HTTP Request 노드의 Method 기본값은 GET이기 때문에 혹시 GET이 아니면 수정해주도록 한다. Add 버튼을 클릭하면 파라메터 정보를 입력받게 된다.


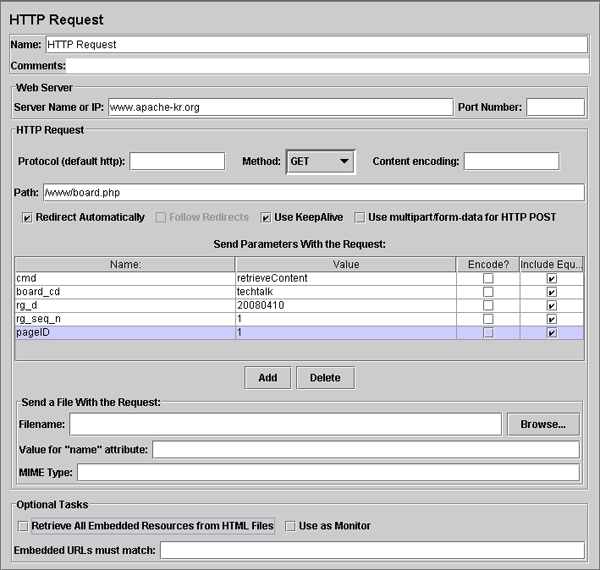
본문에서는 Add 버튼을 5번 눌러 파라메터 입력을 5개 만들었다. 입력할 파라메터는 다음 목록과 같다.

cmd
board_cd
rg_d
rg_seq_n
pageID

서버 정보 및 파라메터 정보를 모두 입력한 화면은 [그림 4-2]와 같다.


[그림 4-2] 테스트 정보를 모두 입력한 화면


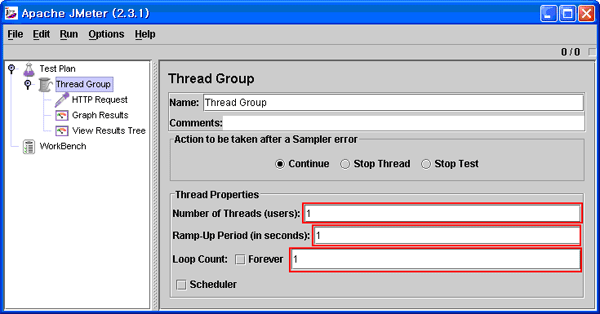
HTTP Request 정보를 모두 입력했다면 Thread Group에 관한 설정을 할 차례다. JMeter의 왼쪽 트리에서 Thread Group 노드를 선택하면 [그림 4-3]과 같은 화면이 나타난다.


[그림 4-3] Thread Group 정보 입력


[그림 4-3]에 보이는 Thread Group 정보는 몇가지 예의 주시해서 입력해야 할 정보가 있다.


첫번째 박스는 몇 명의 사용자로 동시 접속 부하를 줄것인지에 대한 것인데 사용자명을 높게 지정할수록 서버의 부하 테스트도 더 커진다.

두번째 박스는 한명의 사용자가 접속자가 서버로 부하를 주러 떠나고 다른 사용자가 부하를 주러 떠날 때 사용자간의 접속 시간을 지정한다. JMeter 문서에는 쓰레드의 생성 주기를 나타낸다고 하지만 이해를 돕기 위해서 사용자간의 접속 시간으로 보면 된다.


세번째 박스는 Thread Group에 속해있는 Sampler들을 몇번 보낼 것인지 지정한다. 이해가 어렵다면 HTTP Request에서 지정했던 URL을 Loop Count 에 지정한 숫자만큼 다시 서버에 요청을 한다고 이해하면 된다. 만약 Forever 박스를 체크했다면 JMeter 실행자는 JMeter를 수동적으로 정지시켜줘야 한다.


본문에서는 Number of Threads(users)를 10명으로 Loop Count는 3으로 수정하였다. 이 숫자나 양은 테스트 부하에 따라 적절하게 조정해주면 된다.


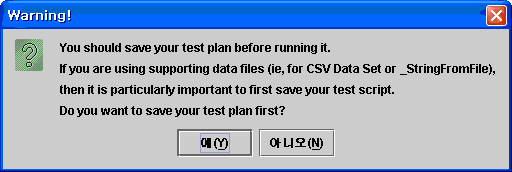
이제 부하 테스트를 해볼 차례다. 부하 테스트는 메뉴에서 Run > Start를 선택하거나 Ctrl + R 키를 누르면 Test Plan을 저장할 것인지 묻게 되고 아니오(N)을 누르면 테스트를 시작한다. 만약 Test Plan이 저장되어 있다면 바로 부하 테스트를 시작하게 된다.


[그림 4-4] 테스트 계획을 저장하시겠습니까?


부하가 진행되는 중에는 [그림 4-5]에 있는 네모 박스에 녹색불이 들어오면서 테스트를 시작한다.


[그림 4-5] 부하가 진행중인 표시


부하 테스트가 끝나면 JMeter의 왼쪽 트리에서 View Results Tree를 선택하면 오른쪽 화면이 [그림 4-6] 처럼 바뀌게 된다.


[그림 4-6] View Results Tree


[그림 4-6]과 같이 테스트한 결과가 출력되었다면 테스트는 정상적으로 이루어진 것이다. 하지만 종종 화면 좌측에 보이는 초록색의 삼각 아이콘 모습이 나타나지 않으면 네트워크 연결 오류나 서버측 오류로 인해 테스트할 없는 상황으로 본다.


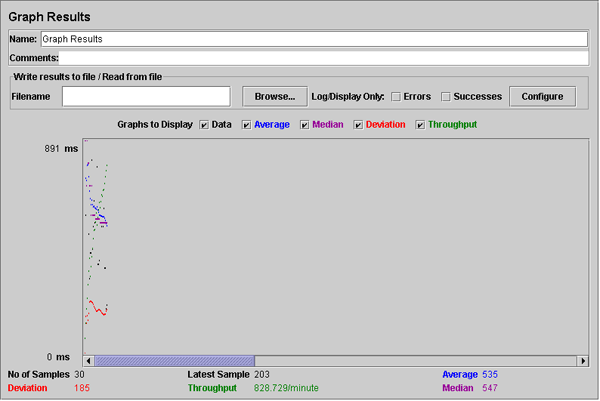
다음 [그림 4-7]은 Graph Results 노드를 선택한 결과이다.


[그림 4-7] Graph 결과로 표시된 부하 테스트


http://network.hanb.co.kr/view.php?bi_id=1522


5. JMeter를 사용한 실제 전략


본 섹션에서는 JMeter를 사용해 실제로 로그인하고 로그인한 정보를 바탕으로 접근 가능한 URL에 접근해 부하 테스트를 진행해보겠다.


본문에서는 테스트를 설명하기 위해서 daum 에 로그인하고 저자가 카페지기로 있는 사이트에 가서 특정글에 대한 요청을 서버에게 던져서 정상적으로 글을 가져오는지 확인해보겠다.


우선 다음과 같이 Test Plan 노드를 추가한다.


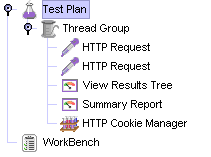
[그림 5-1] Daum의 Café에 접속하기 위해 글을 가져오기 위한 Test Plan


[그림 5-1]과 같이 Test Plan을 만들면 되는데 가만 보면 못 보던 요소가 하나 존재한다. 바로 HTTP Cookie Manager인데 Cookie Manager는 JMeter 2.0.3 부터 새로이 추가된 element다.


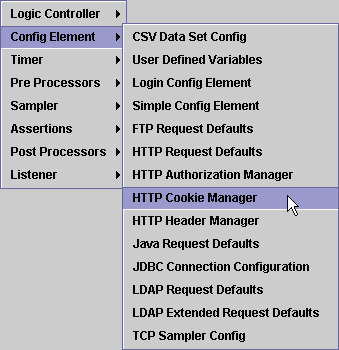
이 element의 추가는 [그림 5-2]에서 보이는 것과 같이 추가한다.


[그림 5-2] HTTP Cookie Manager 추가하기


Cookie Manager는 Thread Group이나 Test Plan 노드에 추가해도 되는데 Test Plan 노드에 추가하는 경우는 여러 Thread Group이 모두 로그인 페이지를 요구하는 경우 유용하게 사용할 수 있다.


반대로 특정 Thread Group에서만 로그인 페이지를 요구하는 경우 Thread Group에만 추가하면 된다.


그리고 HTTP Request Sampler를 총 2개 추가한다.


HTTP Request Sampler는 다음 [그림 5-3]과 같이 설정한다.


[그림 5-3] HTTP Request 1


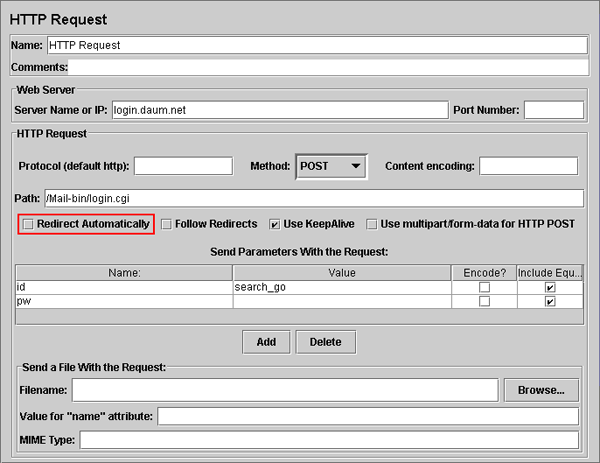
첫번째 HTTP Request는 Daum에 로그인 요청을 하는 Sampler이다. [그림 5-3]에 보이는 요소에 대해서는 섹션 4에서 다루었기 때문에 섹션 4와 비교했을 때 다른 것만 알아보기로 한다.


[그림 5-3]에는 빨간 박스로 강조되어진 부분이 있는데 이 부분은 JMeter에서 요청을 한후 자동으로 주소를 변경할지를 설정하는데 일부 사이트의 경우 이 옵션이 켜져 있을 경우 문제가 된다. 때문에 로그인하는 요청의 경우 옵션은 해제해주는게 좋다. 그리고 Follow Redirects 옵션을 켜주는게 좋다. Follow Redirects 옵션은 웹 사이트의 Redirect 액션을 허용한다.


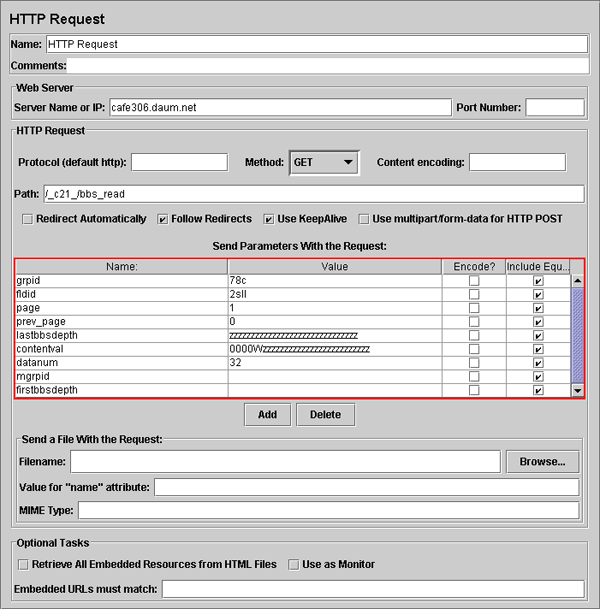
[그림 5-4]는 실제 게시물에 접근하는 요청이다. 이때 접근하는 URL은 미리 페이지 등록정보를 통해 확인한 URL을 이용한다.


[그림 5-4] HTTP Request 2


[그림 5-4]는 게시물에 접근하는 요청이다. 빨간 박스로 강조된 부분은 Path에 인자로 넘겨지는 부분인데 이와 같이 URL에 접근에 있어서 파라메터를 요구하는 경우는 1개씩 인자를 생성해주어야 한다.


이제 요청 결과를 알아보기 위해 Test Plan을 실행한다. Test Plan의 실행은 Run > Start 메뉴를 선택하거나 Ctrl + R 키를 누른다.


그럼 [그림 5-5]와 같이 Test Plan을 저장할 것이냐고 물어오는데 본문은 테스트이므로 아니오를 눌러 저장하지 않는다.


[그림 5-5] Test Plan을 저장할것입니까?


스트레스 테스트가 끝나면 JMeter의 왼쪽 트리에서 View Results Tree 노드를 선택한다.


[그림 5-6] View Results Tree 노드 선택


이제 JMeter의 화면 오른편에는 [그림 5-7]과 같은 화면이 있는 걸 볼 수 있다.


[그림 5-7] View Results Tree 초기 화면


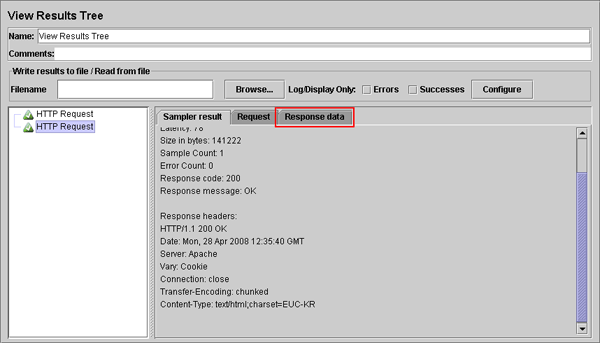
이제 [그림 5-7]에 보이는 항목을 클릭하면 [그림 5-8]과 같이 변경된다.


[그림 5-8] 2번째 HTTP Request 클릭 후


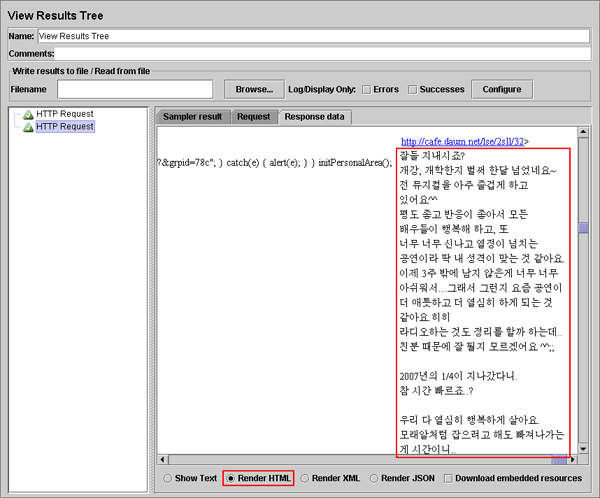
[그림 5-8]의 결과를 보면 정상적으로 수행은 된거 같은데 어떤 결과가 왔을지 사뭇 궁금해진다. 결과를 확인하기 위해 [그림 5-8]에 보이는 Response data 탭을 클릭하고 적절하게 위치를 이동하면 아래와 같은 결과를 확인해볼 수 있다.


[그림 5-9] 정상적으로 받아온 데이터


[그림 5-9]에 보이는 화면과 같이 데이터를 정상적으로 받아온 것을 확인할 수 있다. 물론 [그림 5-9]에 보이는 것과 같이 보이지 않는다면 [그림 5-9] 하단에 보이는 Render HTML이나 Show Text 라디오 버튼을 선택해야 한다. Render HTML의 경우 일부 웹 사이트는 정상적으로 보여지지 않을 수 있기 때문에 Show Text 라디오 버튼을 선택해서 보는 것이 더 정확하다.


사족으로 [그림 5-9]에 보이는 내용은 가수 이소은씨가 팬카페에 2007년 4월에 게시판에 남겨준 내용이다.


여기까지 잘 따라왔다면 정상적으로 처리가 되어야 하지만 그렇지 않다면 뭔가 이상이 있는 경우이므로 다시한번 확인해보기로 한다.


6. JMeter 로그 분석하기


JMeter로 테스트는 했는데 정작 테스트 결과를 볼 수 없거나 엉뚱한 자료만 가지고 있다면 분석은 못하게 될것이다.


이를 위해서 Listener로 Summary Report element를 추가해주는 것을 권장한다.


섹션 5에서 수행했던 Summary Report를 보면 [그림 6-1]과 같다.


[그림 6-1] Summary Report


[그림 6-1]은 섹션 5에서 수행된 Summary Report인데 눈여겨 봐야 할 컬럼은 총 5개로 위 그림에서 강조되어 있다.


결과 분석을 위해 첫번째 컬럼부터 살펴본다.

  • 1번째 컬럼 : 서버에 요청한 횟수
  • 2번째 컬럼 : 평균 응답시간(ms단위)
  • 3번째 컬럼 : 최소 응답시간(ms단위)
  • 4번째 컬럼 : 최대 응답시간(ms단위)
  • 5번째 컬럼 : Error(%단위)

5번째 컬럼을 제외하곤 4번째 컬럼까지는 값의 단위는 밀리 세컨드 단위(ms)이다. 1초는 0.001 밀리세컨드이다. 계산이 귀찮다면 google 에 밀리 세컨드 값을 넣고 다음과 같이 검색어를 입력한다.


78 milliseconds to seconds


그러면 google이 자동으로 계산해준다.


5번째 컬럼은 서버로의 요청 중에 문제가 있을 경우 에러가 났다거나 한 경우 그 에러율을 퍼센테이지로 표시해준다.


여기서 살펴본 것을 기준으로 간단한 보고서 작성이 가능하겠으나 더 자세한 보고서 작성을 위해 JMeter User Manual을 참조해 다양한 Listener 추가를 통해 다양한 결과 형태를 볼 수 있으므로 꼭 한번씩 참조해서 실행해보는 것을 권장한다.


7. JMeter 활용 전략


JMeter는 그 초기 목적과 달리 다양한 테스트를 위해 확장되고 있으므로 여러 목적으로 사용할 수 있다.


따라서 저자는 JDBC, Java Request, JUnit, FTP 등을 테스트 하기 위해 JMeter 사용을 권장한다.


JMeter의 보다 폭 넓은 활용을 위해서 다음과 같은 사용 전략을 제시한다.

  • JDBC 테스트 : DB 얼마나 부하를 견딜 있는지 알고 싶다
  • Java Request 테스트 : 순수 자바 애플리케이션을 만들고 있는데 별도의 테스트 툴이 없어서 힘들다.
  • JUnit 테스트 : 애플리케이션 테스트를 위해 Junit Test Case 만들었는데 JMeter 대신 실행해서 JUnit 부하 테스트 하는데 사용하고 싶다.
  • FTP 테스트 : FTP 서버를 구축했는데 얼마나 접속했을 다운되는지 알고 싶다(실제 이렇게 사람이 있는지 모르겠다)

물론 위와 같은 사용 제시 외에도 JMeter는 대표적인 오픈소스 IDE인 Eclipse와 연동해서 사용하는 것이 가능하다. 다음에 기회가 되면 이 같은 사용법을 제시할 수 있기 바란다.


원본 위치 <http://koong.net/index.php?gotopage=6&MenuID=1&list_count=10&process=del&mode=view&idx=593>


반응형

+ Recent posts